Hierarchical Clustering
Cluster analysis classifies genes, and possibly experiments as well, so that each gene (or experiment) is very similar to others in the cluster with respect to some predetermined selection criterion. For a distance criterion the following measures are available: Euclidean, Squared Euclidean, Standardized Euclidean, City Block, Chebychev, Power Distance, Mahalanobis and Minkowski. For the connecting of groups the following linkage types are supported: single, average, complete, centroid and Ward's method.
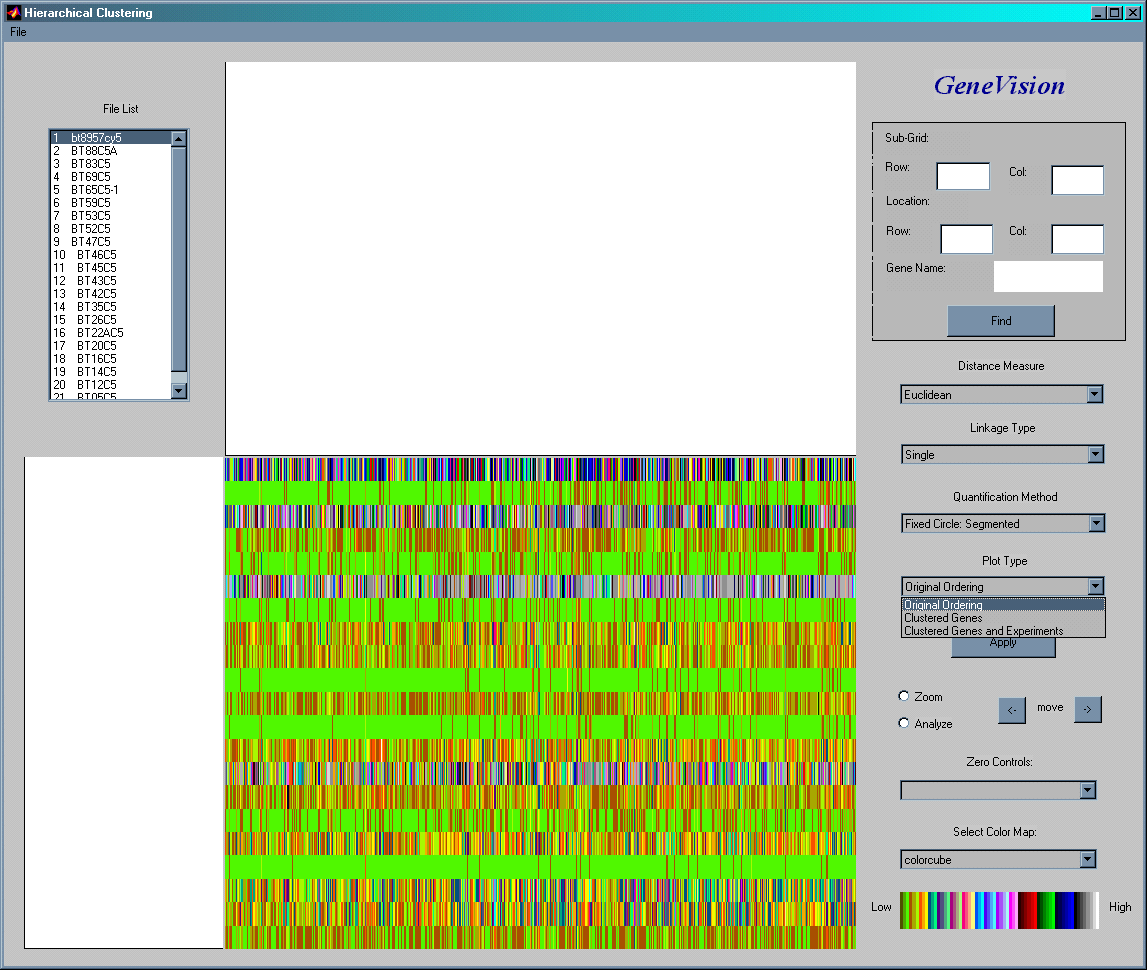
For an example consider expression data on 600 genes in 21 experiments shown above before clustering. Gene expression levels are color coded based on the key in the bottom right corner.
The image above shows the two-way clustering of the 600 genes (x-axis) in 21 experiments (y-axis). The two dendrograms show the clustering of genes (on top) and of experiments (on left side). As mentioned at the top there are many different distance measures and linkage types are available to do the hierarchical clustering.