Principal Component Analysis
This module performs Principal Component Analysis of the data. This multivariate technique is frequently used to provide a compact representation of large amount of data by finding the dimensions (principal components) on which the data varies most. There are two windows being created for this analysis: PCA Plot Parameters and Scatter Plot.
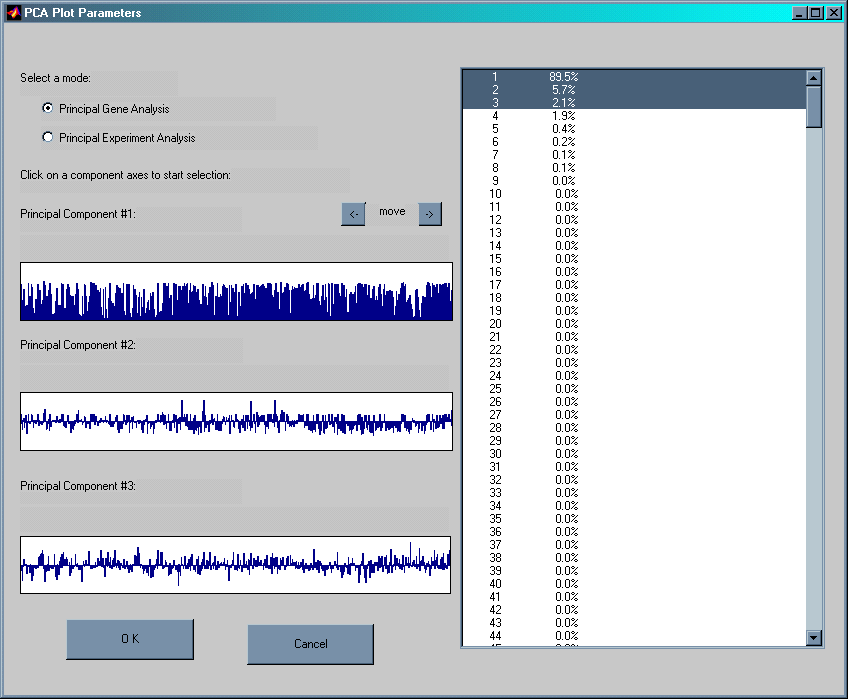
As default the PCA Plot Parameters window displays the so called Principal Gene Analysis. The linear combination of gene expression levels on the first three principal components are shown. By clicking inside the windows a sliding bar reveals the contribution of each gene to the three first principal components.
The Scatter Plot window plots all the experiments/files according to their score on the first three principal components. This method could be used to reveal possible clustering of the experimental files in the data. The figure above shows a low dimensional representation of a ~600 gene data data. The coefficients of all genes are plotted on the first three principal components. Alternatively, the 21 experiments could also be plotted to explore possible clustering of different experiments. This method provides an excellent way to find clusters and outliers in the data.